Experimental Investigation of Two- and Three-Dimensional Aerodynamics of a NACA 4412 Airfoil
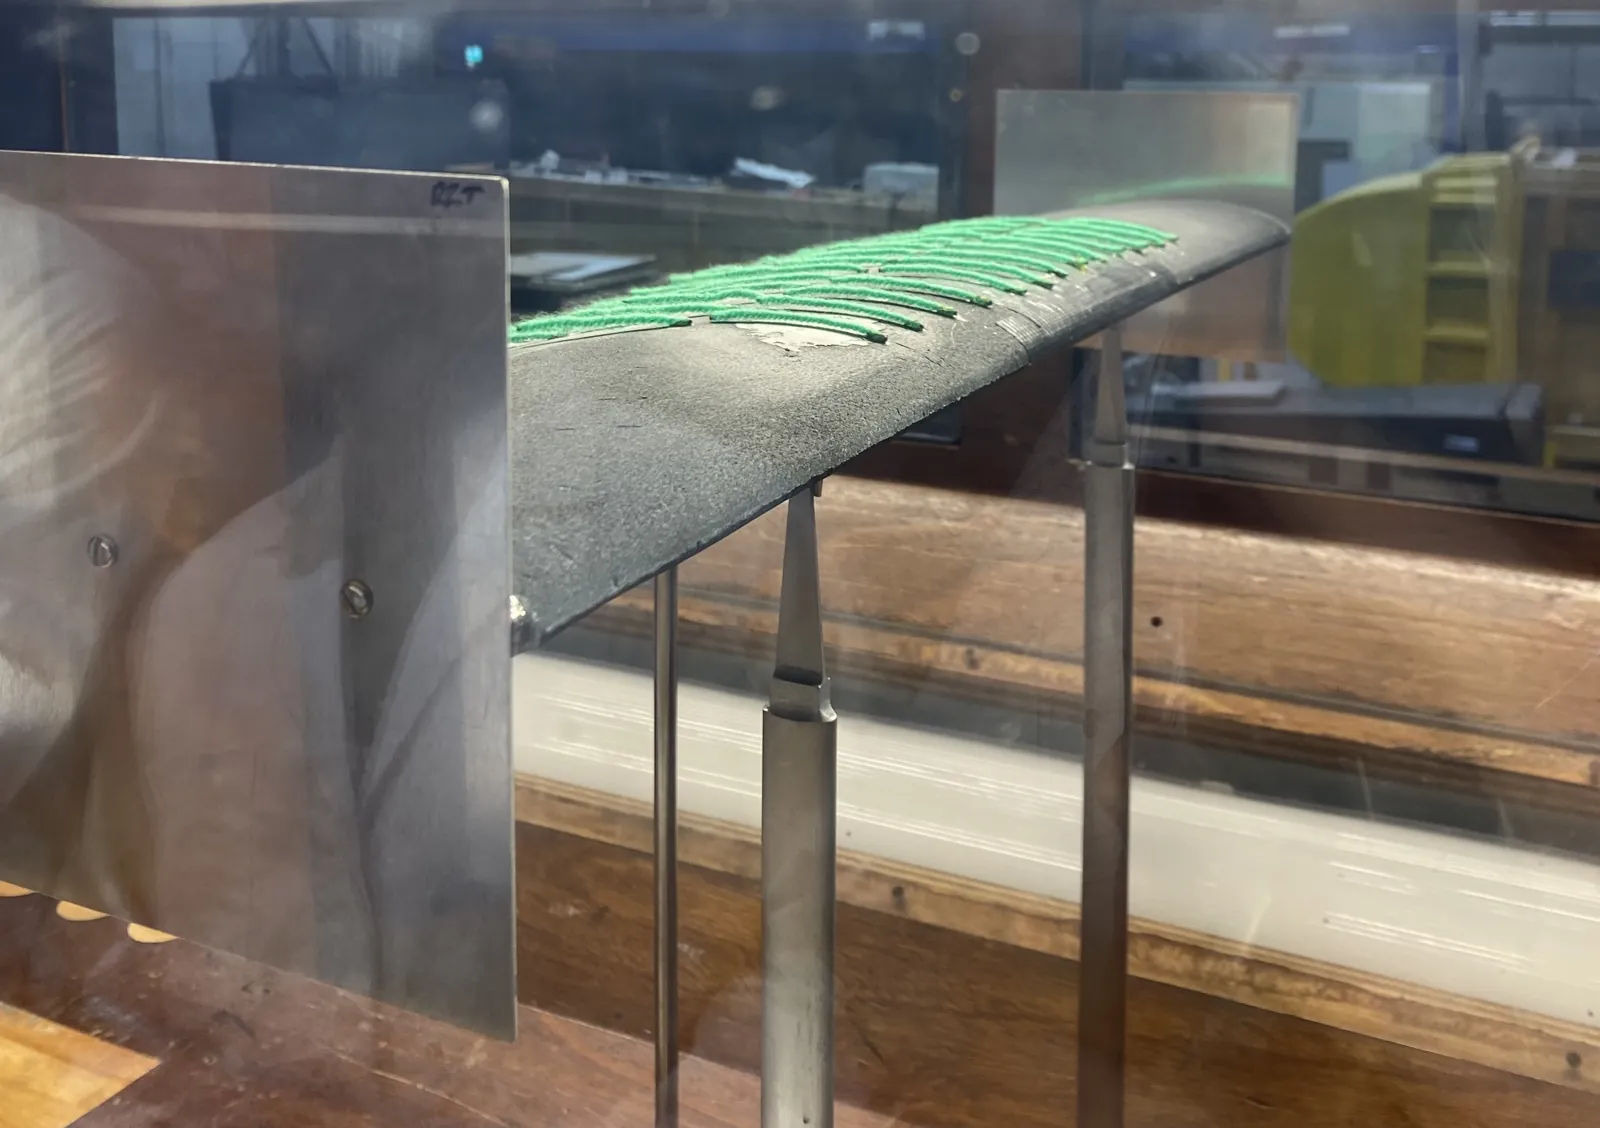
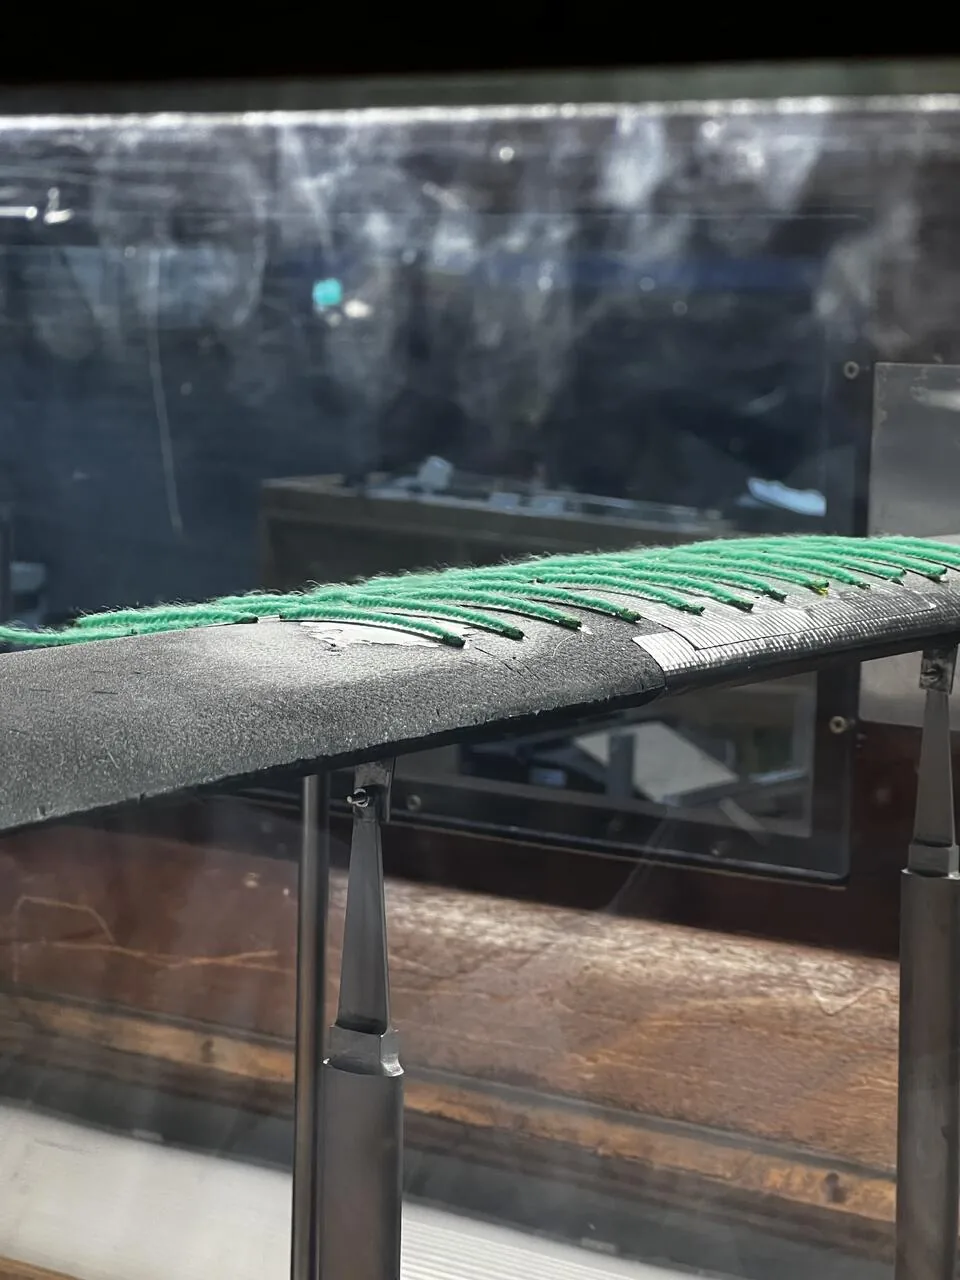
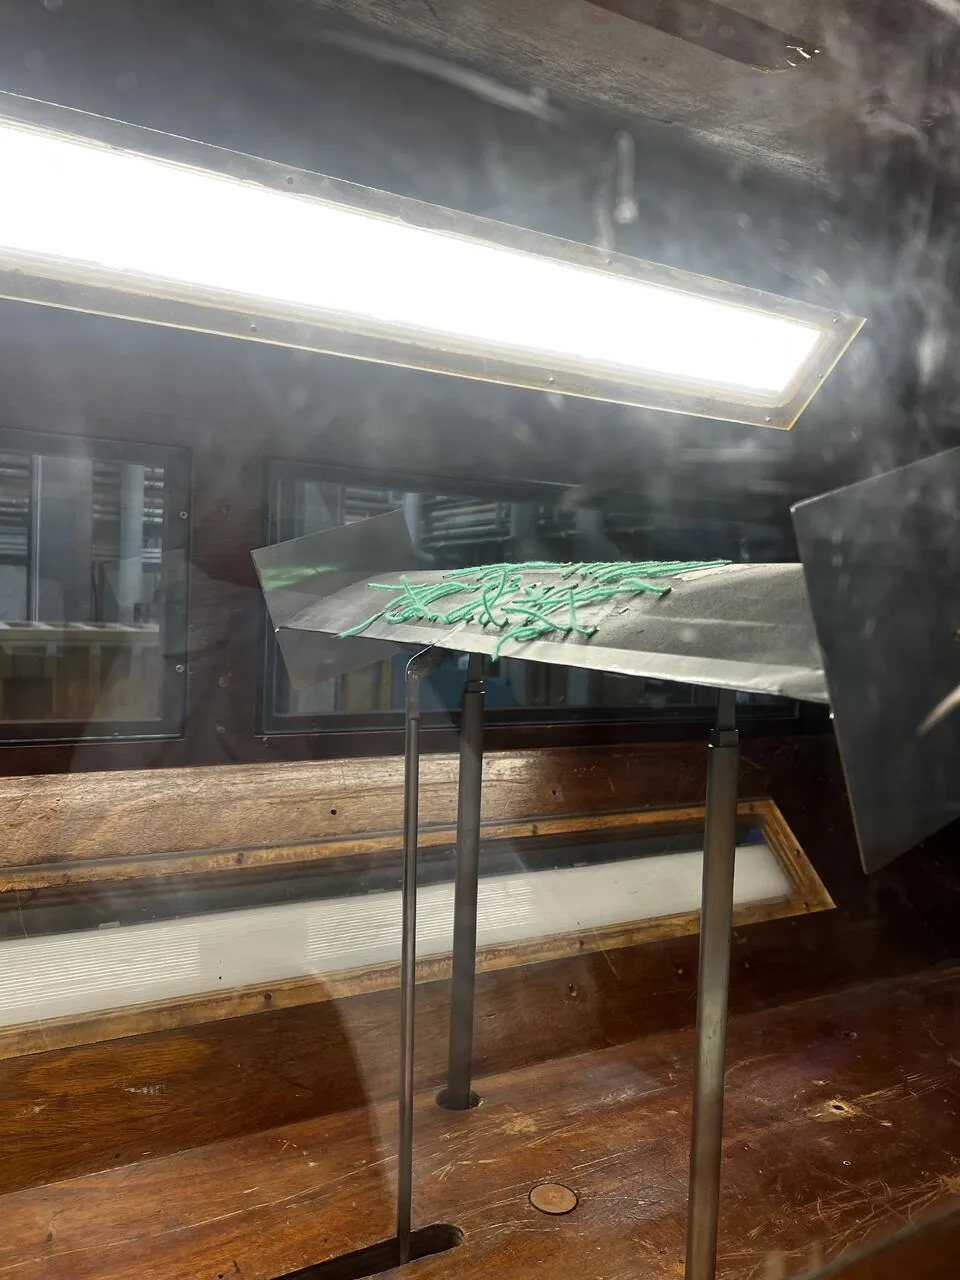
A team of five testing a NACA 4412 in UL's low-speed wind tunnel, as an end-plated 2D section and as a finite 3D wing. Most of the work was separating what the airfoil does from what the supports and the tunnel do, then comparing the corrected results with XFLR5, theory and published data.
- Team
- Five students, University of Limerick
- When
- Nov 2025
- Tools
- Wind tunnel, XFLR5, Python, Excel
Problem
Simulation tools give clean 2D polars. A real wing in a real tunnel has finite span, tip vortices and struts in the flow. We wanted to measure how large those differences are for a NACA 4412, and how much of the drag reading belongs to the airfoil at all. The report had three aims:
- Measure lift, drag and pitching moment for 2D and 3D configurations and quantify the 3D penalty.
- Compare directly measured drag with an indirect measurement from a wake survey.
- Locate the aerodynamic centre from the pitching moment data and compare it with theory.
My role
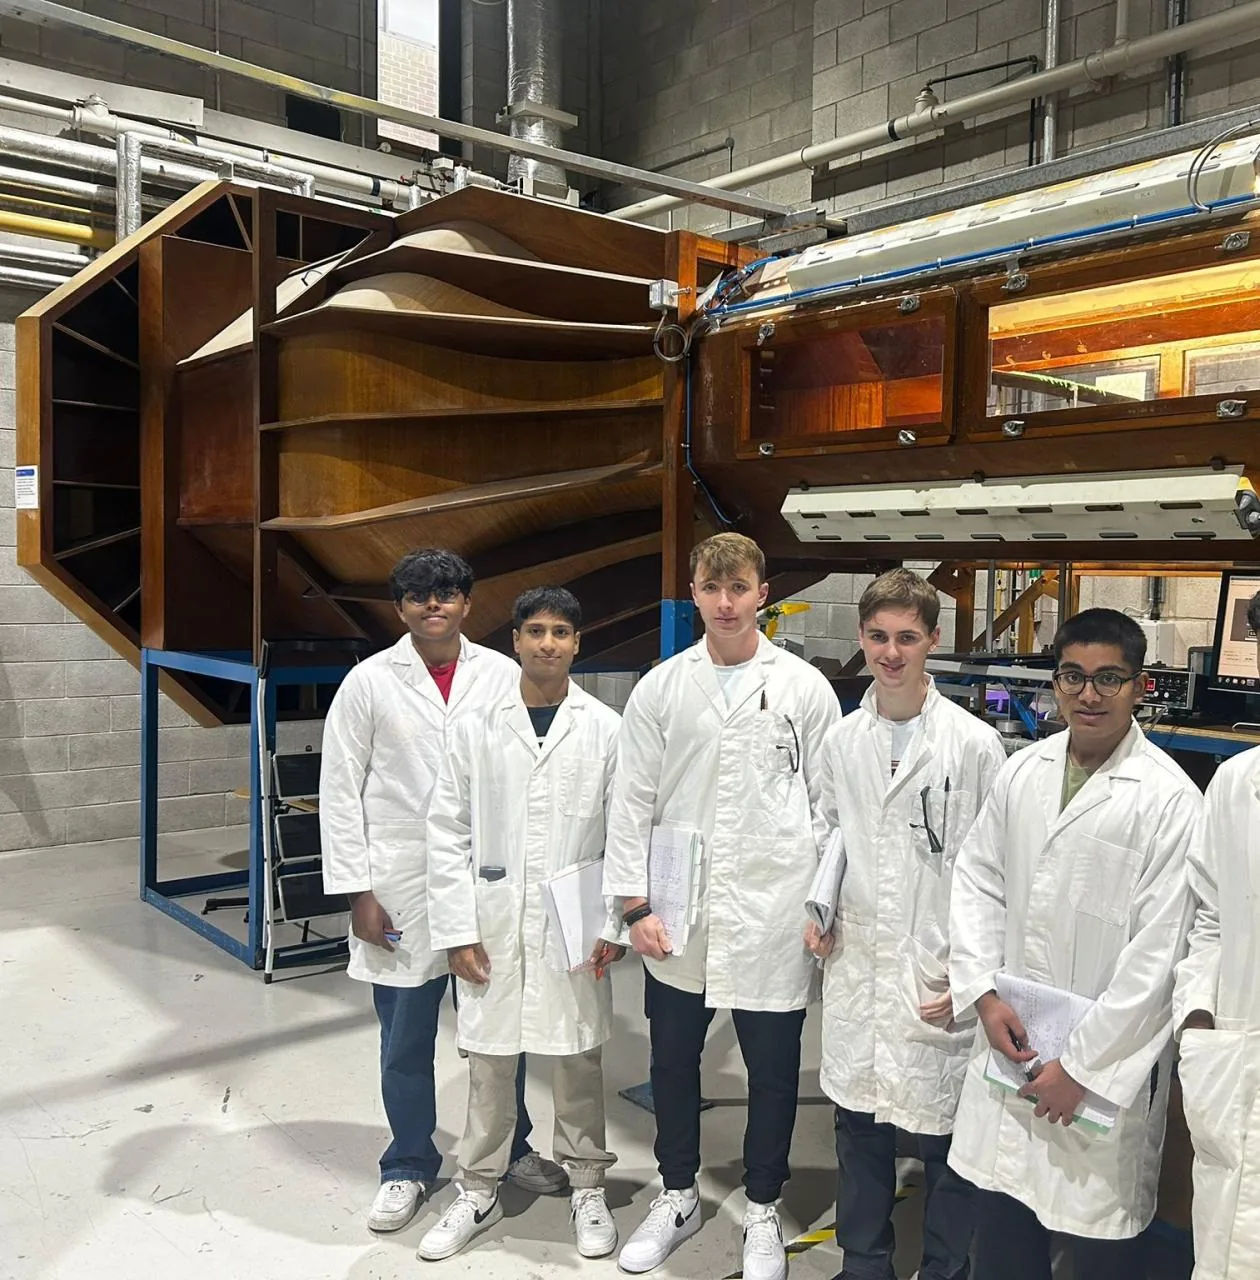
Team of five: Delvin Louis, Michael Barrett, Rory Fenton, Rushil Ramesh and me. The Excel workbook and Python code in the report's appendix are mine.
Method
- Tests. Angle of attack sweeps from −4° to 20° at two tunnel speeds, Reynolds numbers of roughly 120,000 and 180,000, first with end plates (approximating 2D) and then as a finite 3D wing.
- Airfoil check. We traced the section in SolidWorks (12% thick, 4% camber at 40% chord) and confirmed it as a NACA 4412 by comparing the measured coefficients with XFOIL results for candidate airfoils using a root-mean-square error.
- Data reduction. Lift and pitching moment coefficients from the balance readings, in Excel and Python. The aerodynamic centre came from a linear regression of Cm against CL in the pre-stall range.
- Drag decomposition. The skin friction and pressure drag of the end plates and struts were calculated and subtracted from the measured total, leaving the airfoil drag.
- Wake survey. The momentum deficit across a 21-point wake profile was integrated to give an independent drag figure.
- Comparison. Results were set against XFLR5, thin-airfoil theory and three published studies.
Assumptions
- The flow was treated as transitional, because tunnel turbulence triggers transition early at these Reynolds numbers.
- Oswald efficiency: the standard approximation gave an unrealistic 0.93 for an aspect ratio of about 4.06, so I used a lifting-line formula, which gave 0.67.
- Strut and end plate drag coefficients were chosen from published values (2 for the end plates, 0.7 for the tapered struts).
- XFLR5 (through XFOIL) is only reliable at low Reynolds numbers, which suits this range.
Result
- 2D maximum Cl
- 1.33
- Stall angle
- 16°
- Aerodynamic centre
- 24–26% chord
- Grade
- 87%
- The 2D data followed thin-airfoil expectations: a linear lift curve to stall and a zero-lift angle of about −4°.
- The aerodynamic centre came out between 24.1% and 25.8% of the chord, close to the quarter-chord prediction.
- The 3D wing showed a lower lift-curve slope, induced drag at every lifting condition and a lower L/D. Maximum L/D was at about 4° in all four tests.
- Support drag was up to 65% of the total measured drag, so the uncorrected balance data did not represent the airfoil.
Verification
- XFLR5: drag agreed well (RMSE 0.012 to 0.049). Lift deviated more (RMSE 0.12 to 0.22), which we put down to rounding through the calculation chain and to tunnel turbulence and transition.
- Published data: the zero-lift angle matched (−4°). One study stalled at 11° against our 16°, though its own cited reference data stalled near 16–17°.
- Wake survey: the momentum method gave a drag coefficient of 0.391, far above the corrected value, because the survey plane was too close to the trailing edge for the wake to develop. I treated it as a method limitation, not a measurement of the airfoil.
What I’d change
I'd take the wake survey further downstream, where the wake has developed, so the momentum method can be used as a real cross-check on the corrected drag. The report concludes that probe placement matters as much as the calculation.